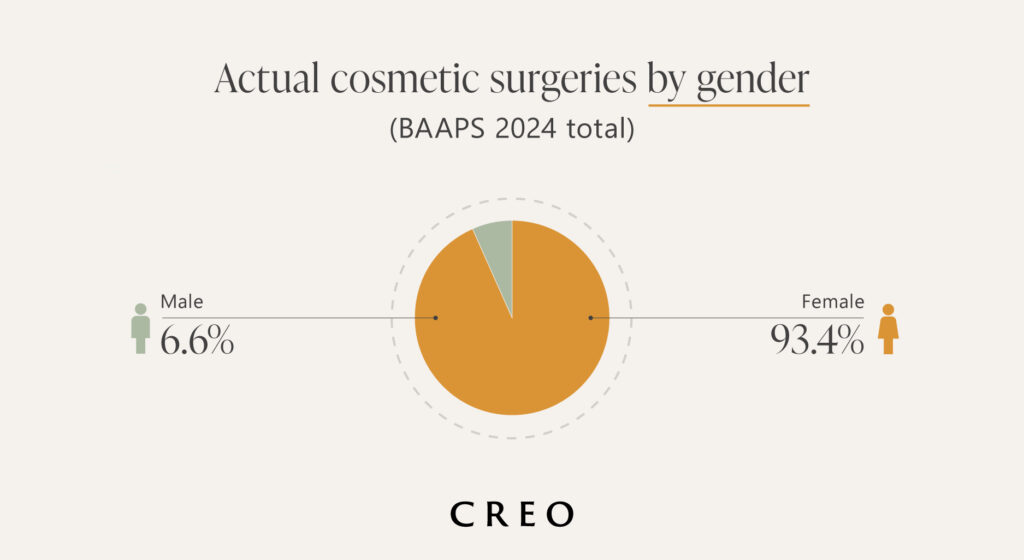
Demand for cosmetic surgery has risen in recent years. According to BAAPS annual audit for 2023-2024, there was a 5% rise in cosmetic surgical procedures, totalling 27,462 in 2024. The report shows that females made up the overwhelming majority of patients (25,663 females compared to 1,799 males), and for women there was a rise in a number of procedures such as abdominoplasty, better known as a tummy tuck (+7%), liposuction (+10%), breast augmentation (+6%), face lift (+7%) and Brazilian Butt Lift (Superficial Gluteal Lipofilling) (+17%). [1]
With this in mind, we surveyed 1,047 UK adults about their current aesthetic satisfaction level and what they would change about their physical appearance if given the opportunity, as well as which factors impact this decision the most.
Key Findings
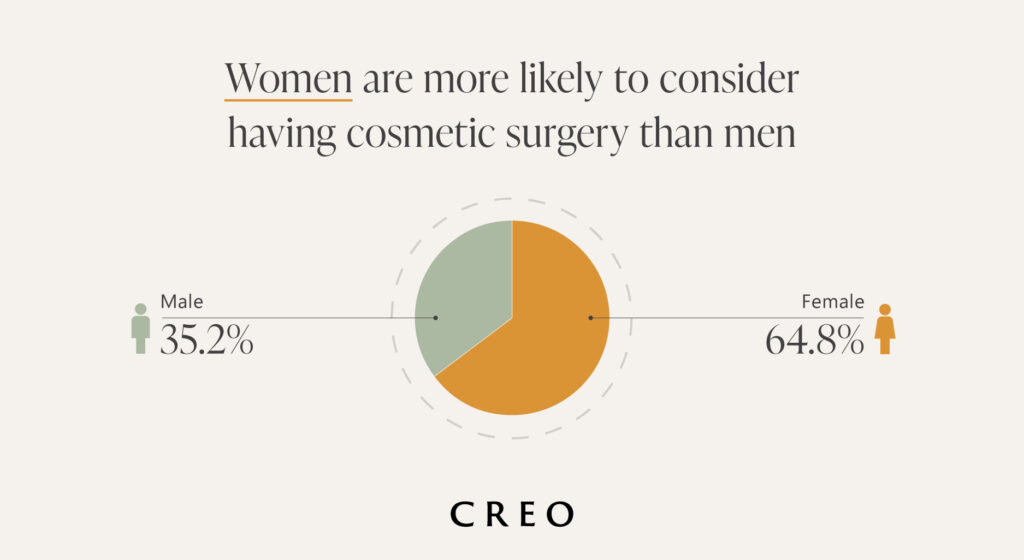
- Over two-fifths (42%) of UK adults have thought about having cosmetic surgery to change their appearance, with women being more likely to consider changes than men (64.8% versus 35.2%).
- 25-34 year olds are most likely to consider having cosmetic surgery (30.7%).
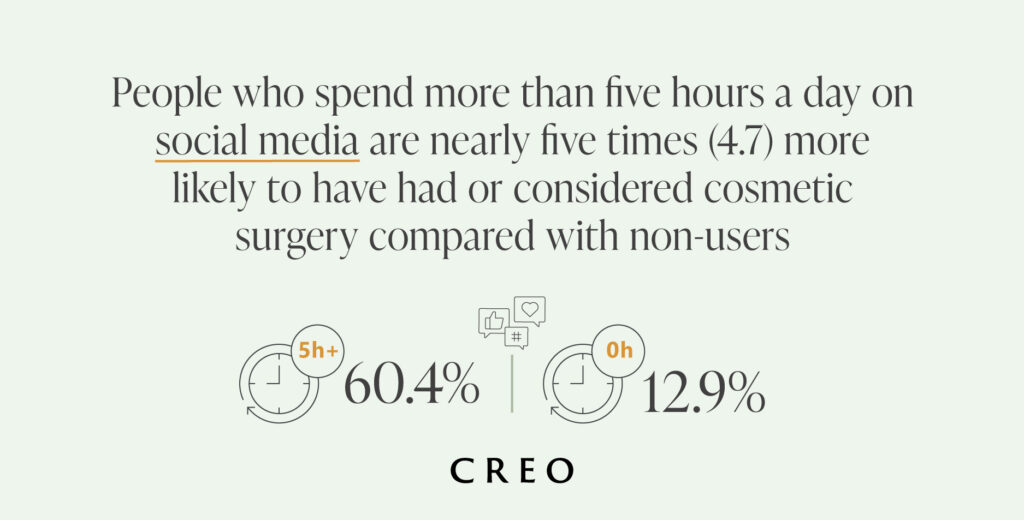
- People who spend more than five hours a day on social media are nearly five times (4.7) more likely to have had or considered cosmetic surgery compared with non-users.
- Participants report feeling most self-conscious about their stomach/abdomen (rated just 5/10), teeth (5.3), waist (5.3) hips (5.5) and thighs (5.6).
- Reducing body fat is the most common thing Brits would change about their bodies (28.5%).
- Majority of Brits (64.6%) want to change their bodies to feel more confident, but over a quarter (26%) said they wanted to look better in photos or social media.
- Women were more likely to believe they would feel extremely confident following this change (60.8% compared to 39.2% of men).
How eager are people in the UK to change the way they look?
As part of the research, we asked participants about their attitudes towards having cosmetic surgery to alter their appearance.
More than two in five people (42%) said they had considered undergoing cosmetic surgery, but only 6.3% had actually gone through with a procedure.
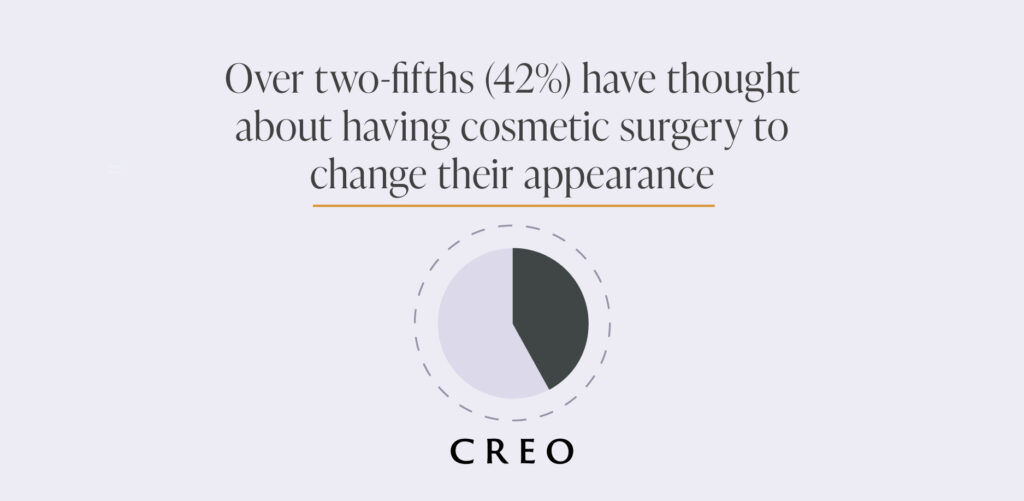
Women were much more likely to think about it than men, making up almost two-thirds (64.8%) of those who had considered surgery, compared with just over a third (35.2%) of men.
When looking at the actual procedures carried out in 2024, BAAPS data shows that women accounted for more than nine in ten procedures (25,663 out of 27,462). According to these figures from BAAPS, this means that women were almost 14 times more likely than men to undergo cosmetic surgery. [1] Although some individuals may have undergone more than one treatment, the figures highlight a clear gender divide.
Across all respondents, 42% of people said they had considered cosmetic surgery, but only 6.3% actually went through with it. This indicates that people think about surgery six to seven times more often than they act on it. Just over half of survey participants (51.7%) said they had never considered surgery, yet the data shows cosmetic procedures remain a significant option for many.
Scaling the survey to the UK population suggests around 28.1 million people have considered cosmetic surgery, including 18.2 million women and 9.9 million men. Looking specifically at the likelihood of moving from consideration to actually having surgery, women were 7.7 times more likely than men to act on their consideration, further highlighting the gender divide in both interest and uptake.
25-34-year-olds are most likely to consider having cosmetic surgery (30.7%)
The research also reveals a clear generational divide in attitudes towards cosmetic surgery: more than a quarter of those who have had surgery were aged 25-34 (28.8%), the same proportion were 35-44 (28.8%), while only 12.1% were 55-64.
This trend is echoed in global data. The ISAPS Global Survey 2024 found that the majority of breast augmentations (54%), rhinoplasties (60.1%), and external genital surgeries (48.4%) were carried out on 18-34-year-olds. [2] These figures suggest that younger generations are more willing to change aspects of their appearance. In fact, those aged 25-34 were the most likely to be considering cosmetic surgery in the future (30.7%), compared with only one in ten (10.5%) of those aged 55–64.
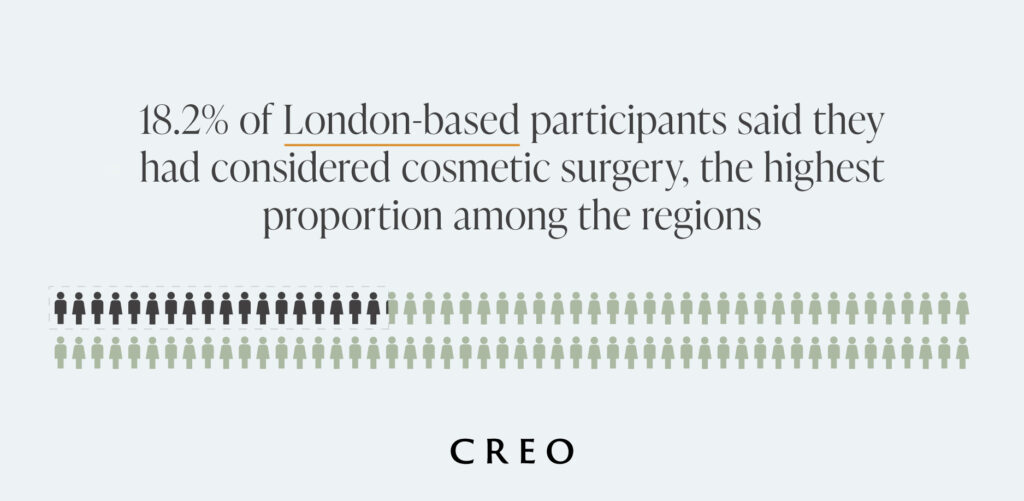
The research also shows a regional divide. Those living in London were most likely to have considered having cosmetic surgery (18.2%), followed by those living in the South East (13%) and North West (11.4%). Research from Harley Street Skin Clinic affirms that residents of Greater London account for the highest number of the clinic’s surgical and non-surgical procedures. [3] This may reflect greater demand in urban areas, as well as the higher concentration and accessibility of clinics.
How does social media influence demand for cosmetic surgery?
As part of the research, we analysed the relationship between time spent on social media and attitudes towards cosmetic surgery.
Our research shows that people who spend more than five hours a day on social media are nearly five times (4.7x) more likely to have had or considered cosmetic surgery compared with non-users (60.4% versus 12.9%). Likewise, the group of participants who spend more than five hours a day on social media had the highest proportion of those who had actually undergone a procedure (9.6%).
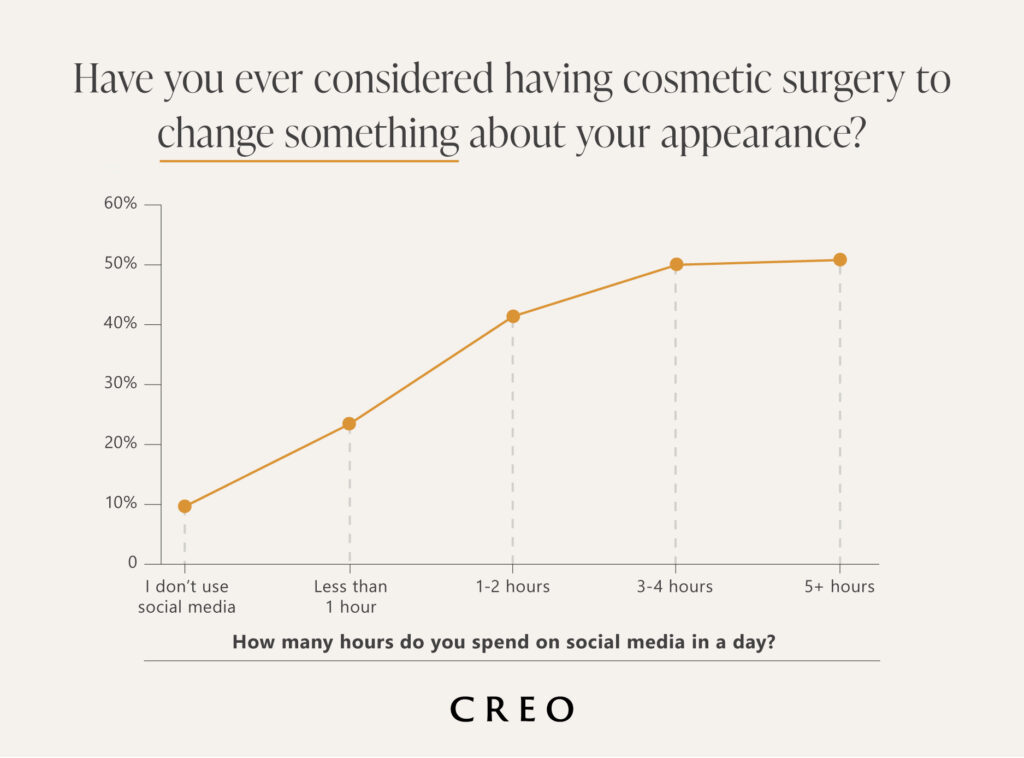
In contrast, those who don’t use social media showed the least interest, with just 9.7% having considered surgery. Similarly, less than a quarter (23.4%) of people who spend around an hour a day on social media had thought about having a procedure. Overall, 87.1% of non social media users hadn’t considered changing their appearance at all, suggesting a clear link between social media use and the desire to alter physical features. Research indicates that social media’s focus on aesthetics and physical appearance can heighten dissatisfaction with our own bodies. [4]
Most common aesthetic changes for social media users
Participants who spent more than five hours a day on social media reported a higher interest in cosmetic enhancements, with 34.6% expressing a desire to enlarge their breasts, 31.3% interested in lip enhancement, and 35.4% wanting to increase their height. In contrast, among participants who did not use social media at all, none expressed interest in breast enlargement, and only 6.3% reported wanting lip enhancement.
People who use social media for more than five hours a day were also more likely to say they believe they would feel extremely confident if they made these changes to their appearance (37.6%), compared with just 7.2% of those who use social media for only one hour a day.
High social media users were far more likely (36.8%) to feel extremely confident after taking steps to improve this part of their body, such as diet and exercise or cosmetic treatments, compared with only 0.8% of non-social media users.
What do Brits currently rate their aesthetic satisfaction level with their body?
Participants were invited to rate their satisfaction with different parts of their appearance. This included their eyes, nose, lips, teeth, skin, hair, arms, chest or breasts, stomach, legs, buttocks, and overall body shape on a scale of one to 10 (one being not at all satisfied and 10 being extremely satisfied). On average, they rated their bodies a score of 6.1 out of 10.
Eyes (7.2), height (6.8) and ears (6.8) currently highest rated body parts
Participants rated their eyes the highest with an average rating of 7.2 out of 10. Following eyes, participants were most content with their height (6.8), ears (6.8), lips (6.7) and hands (6.6) on average. Despite the 13% rise in blepharoplasty (eyelid surgery) between 2023 and 2024, [1] satisfaction with their eyes was fairly consistent across age groups: 18-24 rated 7.0, 25-34 rated 7.4, 35-44 rated 7.2, 45-54 rated 7.1, and 55-64 rated 7.0. Although blepharoplasty is more commonly sought by older individuals who may experience drooping eyelids or sagging skin due to ageing, this consistency suggests that people across all ages are generally satisfied with their eyes.
Alongside this, buttocks were rated highest among women in the 25-34 age group (6.5). In comparison, the lowest satisfaction came from women aged 45-54 (5.3).
| Average rating for body parts | |||
|---|---|---|---|
| Body part | Mean average rating out of 10 (Female) | Mean average rating out of 10 (Male) | Mean average rating out of 10 (Overall) |
| Eyes | 7.2 | 7.2 | 7.2 |
| Height | 6.8 | 6.8 | 6.8 |
| Ears | 6.8 | 6.4 | 6.8 |
| Lips | 6.7 | 6.7 | 6.7 |
| Hands | 6.6 | 6.7 | 6.6 |
| Neck | 6.3 | 6.5 | 6.3 |
| Nose | 6.3 | 6.3 | 6.3 |
| Calves | 6.2 | 6.4 | 6.2 |
| Belly button | 6.2 | 6.3 | 6.2 |
| Buttocks | 6.1 | 6.5 | 6.1 |
| Cheek/jowl | 6.1 | 6.3 | 6.1 |
| Arms | 6.0 | 6.4 | 6.0 |
| Chest/breasts | 6.0 | 6.1 | 6.0 |
| Skin | 6.0 | 6.2 | 6.0 |
| Hair | 6.0 | 5.8 | 6.0 |
| Legs | 5.9 | 6.5 | 5.9 |
| Overall body shape | 5.9 | 6.1 | 5.9 |
| Areola | 5.8 | 6.0 | 5.8 |
| Thighs | 5.6 | 6.1 | 5.6 |
| Hips | 5.5 | 5.8 | 5.5 |
| Waist | 5.3 | 5.6 | 5.3 |
| Teeth | 5.3 | 5.4 | 5.3 |
| Stomach/abdomen | 5.0 | 5.4 | 5.0 |
On the other hand, body parts such as stomach/abdomen (5), teeth (5.3), waist (5.3) hips (5.5) and thighs (5.6) were among the lowest rated.
Despite widespread belief that the UK has bad teeth compared to countries such as the U.S. which spend much more time and money on elective dental care [5], the UK has the fourth highest DMFT score (a dental index that stands for Decayed, Missing, and Filled Teeth), joint with Sweden. The only countries to perform better are Denmark, Germany and Finland. [6]
Alongside this, hair was rated on average 6 out of 10. Women rated this higher than men (6 versus 5.8). The lowest satisfaction with hair came from men aged 35-44, with 29% rating their hair just 1-3. This is followed by 24.4% of men aged 45-54 and 22.6% of men aged 55-64. Male-pattern baldness affects around 6.5 million men in the UK and the UK currently has one of the highest percentages of bald men (40.09%). [7][8] While hair loss can affect men at any age, it’s reported that around 20% of men aged 20 have noticeable hair loss, followed by 25% of men aged 30 and 50% of men aged 50. [9]
The research also showed that women rated their areolas 5.8 out of 10, while men rated them slightly higher at 6 out of 10. Areola reductions are becoming an increasingly popular surgery for people unhappy with the size and shape of their areolas. This surgery reshapes and reduces the size of the areola (the pigmented skin that encircles the nipples) and provides patients with areolas that are symmetrical and proportionate to the size of their breasts.
Overall body satisfaction was similar, with women rating themselves 6.1 out of 10 and men just a fraction higher at 6.2.
The one thing people in the UK would change about their body
Alongside analysing how respondents currently feel about their bodies, we also asked about their desire to change certain parts of their body.
The respondents showed a clear eagerness to reduce body fat as almost three in ten (28.5%) said this would be the one thing they would change if given the opportunity. This was the most common answer across all demographics, however, among those who selected this option, 35.6% use social media for 3-4 hours a day. In comparison, 3% don’t use social media at all.
The second most prominent answer was increasing general muscle tone or definition (8.8%), followed by improving skin quality such as texture or clarity (8.5%).
| What‘s the one thing people would change about their bodies? | ||
|---|---|---|
| Rank | Change | Percentage |
| 1 | Reducing body fat | 28.5% |
| 2 | Increase general muscle tone or definition | 8.8% |
| 3 | Improve skin quality (e.g. texture or clarity) | 8.5% |
| 4 | Tone stomach or waist area | 7.9% |
| 5 | Reduce signs of ageing (e.g. wrinkles or sagging skin) | 6.5% |
On the other hand, just 5.6% of respondents said they wouldn’t change anything about their body at all. This group was more commonly men (62.7% versus 37.3% of women) and scattered across age groups but slightly more concentrated in the 55-64 age group (30.5%).
In comparison, the thing Brits were least likely to change was reducing their lip size (0.3%), lowering height (0.6%) and enhancing jawline (0.9%).
| What people are least likely to change about their appearance | ||
|---|---|---|
| Rank | Change | Percentage |
| 1 | Reduce lip size | 0.3% |
| 2 | Lower height | 0.6% |
| 3 | Enhance jawline | 0.9% |
| 4 | Tone arms | 1.3% |
| 5 | Enlarge lips | 1.5% |
While reducing lip size was an uncommon response, enlarging lips also ranked as the fifth least likely change respondents would make to their appearance (1.5%).
Reducing loose skin (75.7% women vs 24.3% men) reveal gender gap
Reducing loose skin is an area where opinions differ sharply between men and women. Over three quarters of those who selected this option were women (75.7%), compared with just 24.3% of men. Pregnancy in particular can leave excess skin around the abdominal area for women. Abdominoplasty, commonly known as a “tummy tuck,” is a popular surgical option to restore a flatter, firmer stomach.
| The body changes with the biggest gender gap | |||
|---|---|---|---|
| Change | Female (%) | Male (%) | Difference (%) |
| Enlarge breast or chest size | 96.2% | 3.8% | 92.3% |
| Enlarge lips | 93.8% | 6.3% | 87.5% |
| Reduce breast or chest size | 81.8% | 18.2% | 63.6% |
| Reducing loose skin | 75.7% | 24.3% | 51.4% |
| Reduce signs of ageing (e.g. wrinkles or sagging skin) | 72.1% | 27.9% | 44.1% |
| Tone legs or thighs | 70.6% | 29.4% | 41.2% |
| Tone stomach or waist area | 68.7% | 31.3% | 37.3% |
| Lower height | 66.7% | 33.3% | 33.3% |
| Tone arms | 64.3% | 35.7% | 28.6% |
| Reduce stretch marks | 61.1% | 38.9% | 22.2% |
Perhaps unsurprisingly, the option to enlarge breast or chest size was most disagreed upon among men and women. More than nine in ten (96.2%) of those who said they would choose to enlarge their breast or chest size were female, compared to 3.8% of men. Over half (52%) of these women were aged 18-34, while nearly a quarter (24%) were 45-54, showing strong interest in midlife too.
Likewise, over one in three (34.6%) of those who chose breast enlargement as the one thing they would change also use social media for more than five hours a day.
For women, factors contributing to smaller breasts are often associated with genetics, age and body weight. Unlike other body concerns, small breasts are unlikely to drastically change due to a regular exercise routine and balanced diet, meaning that many will turn to breast augmentation or enlargement surgery.
Despite men rating their height on average 6.8 out of 10, significantly more men chose to increase their height compared to women (72.3% versus just 27.7% of women). In the UK, the mean average male height is 1.78 m compared to 1.64 m for women. [10] This equates to five feet eight inches and five feet three inches. In comparison, in the Netherlands, men are an average of 1.84 m tall (6ft) and there are 37 countries ahead of the UK in terms of male height. [11]
Following this, men made up 64.1% of those who said they would increase general muscle tone or definition if given the opportunity.
In addition, 61.1% of those who said the one thing they would change about their body was their hair were men, compared with 38.9% of women. Of all the men that said they would change their hair if given the opportunity, 40.9% were aged 45-54 and 31.8% were aged 35-44. This corresponds with earlier findings that the lowest satisfaction with their current hair came from men aged 35-44, with 29% rating their hair just 1-3.
86.9% have already taken steps to change this aspect of their body
Almost nine in ten (86.9%) respondents said they had already taken steps to change this aspect of their body. The most common actions were following a diet and exercise plan (51.8%), using skincare or beauty products (38%), and considering cosmetic procedures (21.5%). Among those spending more than three hours a day on social media, 52.2% had committed to diet and exercise, highlighting how online beauty and fitness ideals can drive people to take action on their appearance.
What are the reasons behind these desired changes?
When asked for reasoning behind these changes, the most common answer was to feel more confident, cited by 64.6% of respondents.
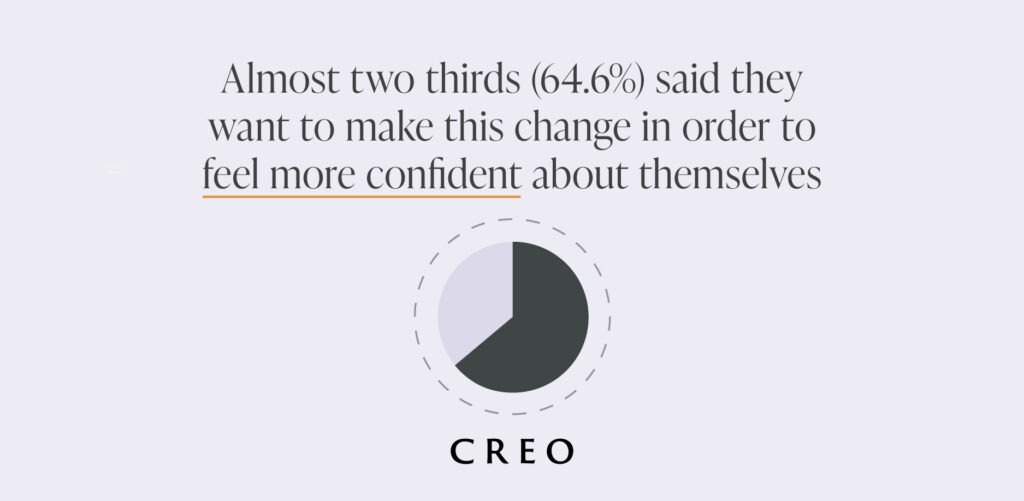
Following this was personal preference (39.1%), to improve health (38.7%) and to look better in photos or social media (26%). Among those who said they want to make this change to look better in photos or social media, over a quarter (26.8%) spend more than five hours a day on social media.
| Top reasons behind these changes | ||
|---|---|---|
| Rank | Reason* | Percentage |
| 1 | To feel more confident | 64.6% |
| 2 | Personal preference | 39.1% |
| 3 | To improve my health | 38.7% |
| 4 | To look better in photos or on social media | 26.0% |
| 5 | To reduce pain or discomfort | 16.9% |
| 6 | To fit better in certain clothes | 16.4% |
| 7 | To align with social or beauty standards | 13.4% |
| 8 | To look like I used to (ie before pregnancy or when I was younger) | 13.0% |
| 9 | For my spouse / partner | 12.8% |
| 10 | To boost professional opportunities | 9.6% |
How cosmetic surgery impacts confidence levels
As 64.6% admitted they’d like to make this change in order to feel more confident, we delved into how cosmetic surgery can impact confidence levels by asking respondents how much more confident they believed they would feel if they were able to make this change.
The highest percentage was 28.5% who said they believed they would feel much more confident following this change. This is followed by almost a quarter (24.9%) who said they believed they would feel moderately more confident.
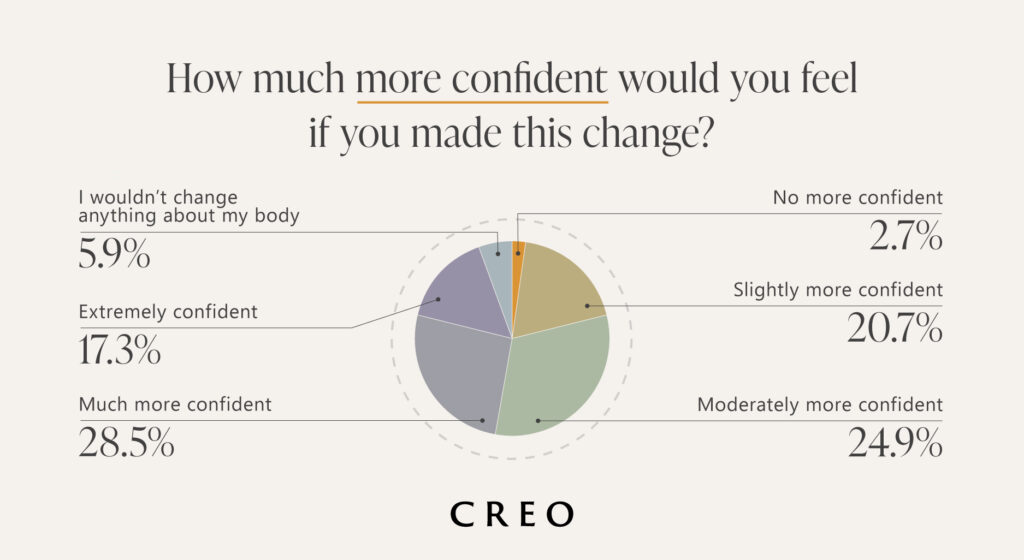
Women were more likely to believe they would feel extremely confident (60.8% compared to 39.2% of men), if they followed through with this change, potentially explaining why the number of women actually opting for surgery is higher than men. Likewise, more men reported that they didn’t think the change would affect their confidence at all (53.6% compared to 46.4% of women).
Difference in confidence following body changes
For those who have already committed to changing this part of their body (such as through exercise or investing in a skincare routine), we analysed how confidence levels changed following this decision.
Among those who had invested in skincare or beauty products, only 15.3% felt extremely confident, while 21.4% reported feeling just slightly more confident.
Interestingly, those who used filters on social media or photo-editing apps experienced the third-highest confidence boost, with 19.6% saying these tools made them feel extremely confident.
For people who said the one thing they would change about themselves was reducing body fat, over half (58.4%) said they had already committed to diet and exercise.
| Changes that have boosted the most confidence | ||
|---|---|---|
| Rank | Change* | Percentage of people who said they felt extremely confident |
| 1 | Considered cosmetic procedures | 24.4% |
| 2 | Committed to a specific exercise | 20.8% |
| 3 | Used social media filters and photo editing | 19.6% |
| 4 | Invested in skincare and beauty products | 15.3% |
| 5 | Committed to diet and exercise | 15.3% |
*Respondents could select more than one answer.
What is stopping people from making this change?
Cost emerged as the leading barrier, with 46.3% saying it was too expensive to make the change. Among those who identified something that could be addressed with plastic surgery, such as changing nose shape, reducing loose skin or enhancing jawline, the figure rose to 53%, citing cost as the main reason they had not gone ahead.
Alongside this, being afraid of risks and procedures was a top reason preventing people from making this change, selected by 30.1%.
| Reasons stopping people from making this change | ||
|---|---|---|
| Rank | Reason* | Percentage |
| 1 | Too expensive | 46.3% |
| 2 | Afraid of risks/procedures | 30.1% |
| 3 | I’ve accepted it | 18.8% |
| 4 | Painful recovery | 16.1% |
| 5 | Don’t have time/busy lifestyle | 16.0% |
*Respondents could select more than one answer.
Almost one in five (18.8%) said the reason they haven’t made this change is because they have accepted the way they look. While the research showed that 25-34 year-olds were the most likely to say they’d change something about their body (especially things like reducing body fat or breast enlargement in women), 26.4% said they’ve accepted the way they look. In comparison, just 14.2% of those who have accepted the way they look were aged 45-54.
Methodology
This survey was conducted on behalf of CREO Clinic by a third-party survey provider. A total of 1,047 UK adults aged 18-64 completed the survey on 31 July 2025. Respondents were recruited online and screened to ensure a broad mix of demographic backgrounds. The survey provider is ISO-certified and carries out 11 trust verifications.
The sample was segmented by:
Gender: Male and Female
Age groups: 18–24, 25–34, 35–44, 45–54, 55–64
Respondents were asked about:
- Attitudes towards cosmetic surgery
- Willingness to undergo cosmetic procedures
- Desired body changes
- Beliefs about whether these changes would impact confidence levels
For some questions, respondents could select multiple answers, so percentages may not total 100%.
Sources
[1] BAAPS, ‘Analysis of BAAPS Audit 2023-2024’ https://baaps.org.uk/_userfiles/pages/files/2024_audit_results_for_2025_release_final.pdf
[2] ISAPS, ‘Global Survey 2024’ https://www.isaps.org/discover/about-isaps/global-statistics/global-survey-2024-full-report-and-press-releases
[3] Harley Street Skin Clinic, ‘Cosmetic Surgery Industry Statistics Aesthetic Trends By Year Age Region And More’ https://www.harleystreetskinclinic.com/data/cosmetic-surgery-industry-statistics-aesthetic-trends-by-year-age-region-and-more
[4] Mironica A, Popescu CA, George D, Tegzeșiu AM, Gherman CD. ‘Social Media Influence on Body Image and Cosmetic Surgery Considerations: A Systematic Review.’ Cureus. 2024 Jul 29;16(7):e65626. doi: 10.7759/cureus.65626. PMID: 39205749; PMCID: PMC11350482. https://pmc.ncbi.nlm.nih.gov/articles/PMC11350482/
[5] Smiles by Hanna, ‘Myths Debunked: The Truth About the British and Their Bad Teeth’ https://www.smilesbyhanna.com/the-truth-about-the-british-and-their-bad-teeth/
[6] Sunbury Dental House, ‘Who Has The Best Teeth In The World?’ https://sunburydentalhouse.com.au/who-has-the-best-teeth-in-the-world/
[7] NHS, ‘Male Pattern Baldness’ https://www.cemc.nhs.uk/clinics-and-services/mens-health/
[8] World Population Review, ‘Baldness by Country 2025’ https://worldpopulationreview.com/country-rankings/baldness-by-country
[9] Bosley, ‘What is the Average Age People Start Losing Hair’ https://www.bosley.com/blog/what-is-the-average-age-people-start-losing-hair/
[10] Statista, ‘Mean height of individuals in England from 1998 to 2022, by gender’ https://www.statista.com/statistics/332542/height-of-individuals-by-gender-in-england-uk/ [11] WorldData.info, ‘Average height and weight by country’ https://www.worlddata.info/average-bodyheight.php
